Power BI Introduction
Charts In Power BI
Power BI DAX
Power BI Interview Questions & Answares
Funnel Chart & Pie Chart
Funnel Chart:
It is a type of chart often used to find stages of a particular data.

Example dataset:

Now the plot:

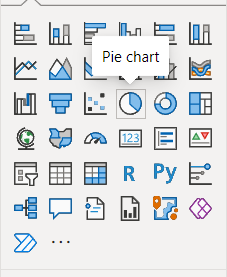
Pie Chart:
This plot is used to show percentage of data of a particular quantity.

Example dataset

Now the data visualization part

About the Author
Silan Software is one of the India's leading provider of offline & online training for Java, Python, AI (Machine Learning, Deep Learning), Data Science, Software Development & many more emerging Technologies.
We provide Academic Training || Industrial Training || Corporate Training || Internship || Java || Python || AI using Python || Data Science etc


